Meterology and Hurricanes in Coastal Louisiana
LOCAL METEOROLOGY
Weather - a combination of temperature, humidity, and winds; a local and temporal phenomenon.
Climate - average of all weather for a particular area.
Aspects that affect our delta (local) climate:
1. Orientation - New Orleans is at 30°N 90°W

-other cities at 30°N: Houston, Cairo, Shanghai
-others places at 90°W: Memphis, St. Louis, Yucatán Peninsula, the Galápagos Islands.
Latitude is very important. At 30°N, we are outside of the tropical region, which is defined as being between the Tropics of Cancer and Capricorn (23.5°N&S, respectively, or 6.5° off of direct incidence of solar radiation). At our latitude, weather is influenced by air mass movements. Winter starts when the first Polar Air Mass arrives and ends with the passing of the last one in the spring.
Our area is subtropical. The key to falling in this category is that the January average temperature must consistently fall between 32° & 64.4°F. Louisiana is the only southeastern U.S. state that falls in this category. Its importance to agriculture and local vegetation is that it defines the length of the growing season. Burrwood, Louisiana (not presently inhabited) has an average of 354 days without a frost; in one 10 year period, it had 6 yrs with no freeze and the other 4 yrs had only one freeze. New Orleans has a growing season averaging about 300 days.
When learning a new field of information, it is fun to learn their language. Meteorologists see maps with various types of data spread around that, to the untrained eye, appears random. They can see areas that contain similar values and they make order of them by connecting similar data inside of connecting lines. When they do this, they use the prefix iso in association of a word that identifies the type of data they are connecting. Here are a list, some we will mention, and others that are just fun to drop in conversation:
- Isobars – lines associated with areas with similar barometric pressure (this is the most commonly used, even on the 6 pm weather forecast)
- Isohumes – same for humidity
- Isophytochrones – same for growing seasons (see the next map)
- Isohyets – same for mean precipitation patterns

. This figure shows the growing season isophytochrones for Louisiana (from Kniffen, 1968).
2. Location - situated between Lake Pontchartrain and the Gulf of Mexico. We are in a marine climate zone, a characteristic of most land within 100 mi of sea water. This and the subtropical status makes our region characteristically humid-subtropical. The New Orleans/delta zone has abundant precipitation (average 60-65 inches/yr) that is relatively evenly distributed throughout the year. Though we tend to have drier and wetter spells, the importance is the availability of water to plants at different time periods. October averages about 3 inches of precipitation, while July averages 7 inches. However, low evaporation in October versus high evaporation in July tends to cause these figures to balance in terms of what is actually available for the plants to use.
Local high humidity in the air is good for plants since it tends to prevent excess evaporation. It also causes our skin to be less wrinkled over our lifetimes (compare to folks from Arizona).
One of the most important effects of being in this zone is local wind movement.
-During summer daytime, we experience onshore winds, i.e., wind moves from the sea (Gulf and Lake) onto the shore where we live. This is due to the fact that the land gets hotter and heats more rapidly than the water, causing the air over the land to rise (convection). As it does, it sucks in the cooler air from over the water to replace it. People in our area who lived around Lake Pontchartrain used to take advantage of this by placing their living quarters on the north sides of their houses in order to be evapo-cooled (one cools down as the sweat evaporates from the body) by cool day breezes blowing from the water. People who lived by other bodies of water placed their living quarters nearest the water.
-During summer nighttime, we experience offshore winds, i.e., wind moves from land toward the sea. This is caused by the land becoming cooler than and cooling more rapidly than the lake. The result is air over the lake being warmer, so it rises by convection and the cooler air over the land moves in to replace it. People who lived along Lake Pontchartrain took advantage of this nighttime air movement by placing their sleeping quarters on the south and southeastern sides of their homes in order to be evapo-cooled by cool night breezes blowing over their bodies as the air left land and rushed toward the lake.
As long as there is a heat differential between land and the lake, the direction the wind blows is predictable. Of course, this is true between different places on land, too (e.g., the concrete Central Business District heats much more rapidly than areas like the Louisiana Nature Center, City Park and surrounding neighborhoods, so which way does the air tend to move?). When there is no huge differential (usually in the winter), then other forces govern the direction of wind movement (e.g., storms, fronts, etc.).
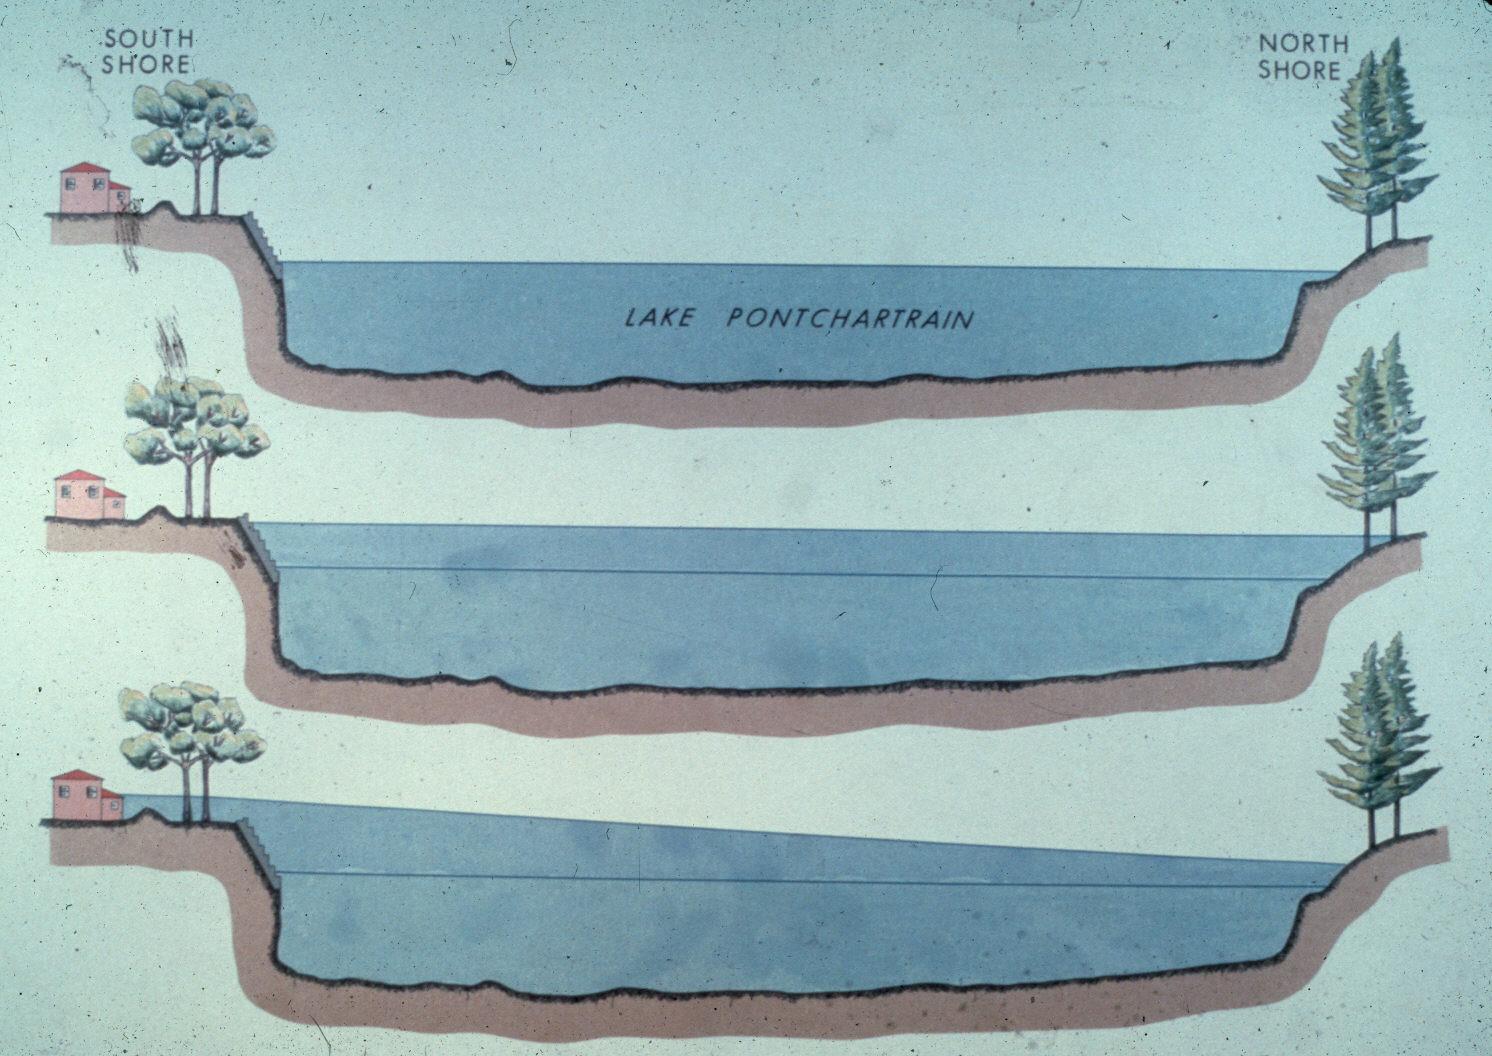
Our position near large bodies of water has another influence, this time on the arrival of very cold weather. Large bodies of water hold heat longer than land. After months of heating, Lake Pontchartrain becomes thoroughly heated and functions much like a hot water bottle (we benefit from the hot water bottle effect). As cold fronts begin to reach south Louisiana, their effects on north shore are very different than on south shore. The land on north shore tends to rapidly adjust to the cold air in the front. South shore, however, is buffered by the warm lake. In the fall and early winter, south shore normally is many degrees higher on a given night than north shore. The lake, however, cools more and more each day as winter approaches. When the lake reaches its low, then it may discontinue serving as our hot water bottle and the next cold front blows across the lake and affects south shore much as it does the north.
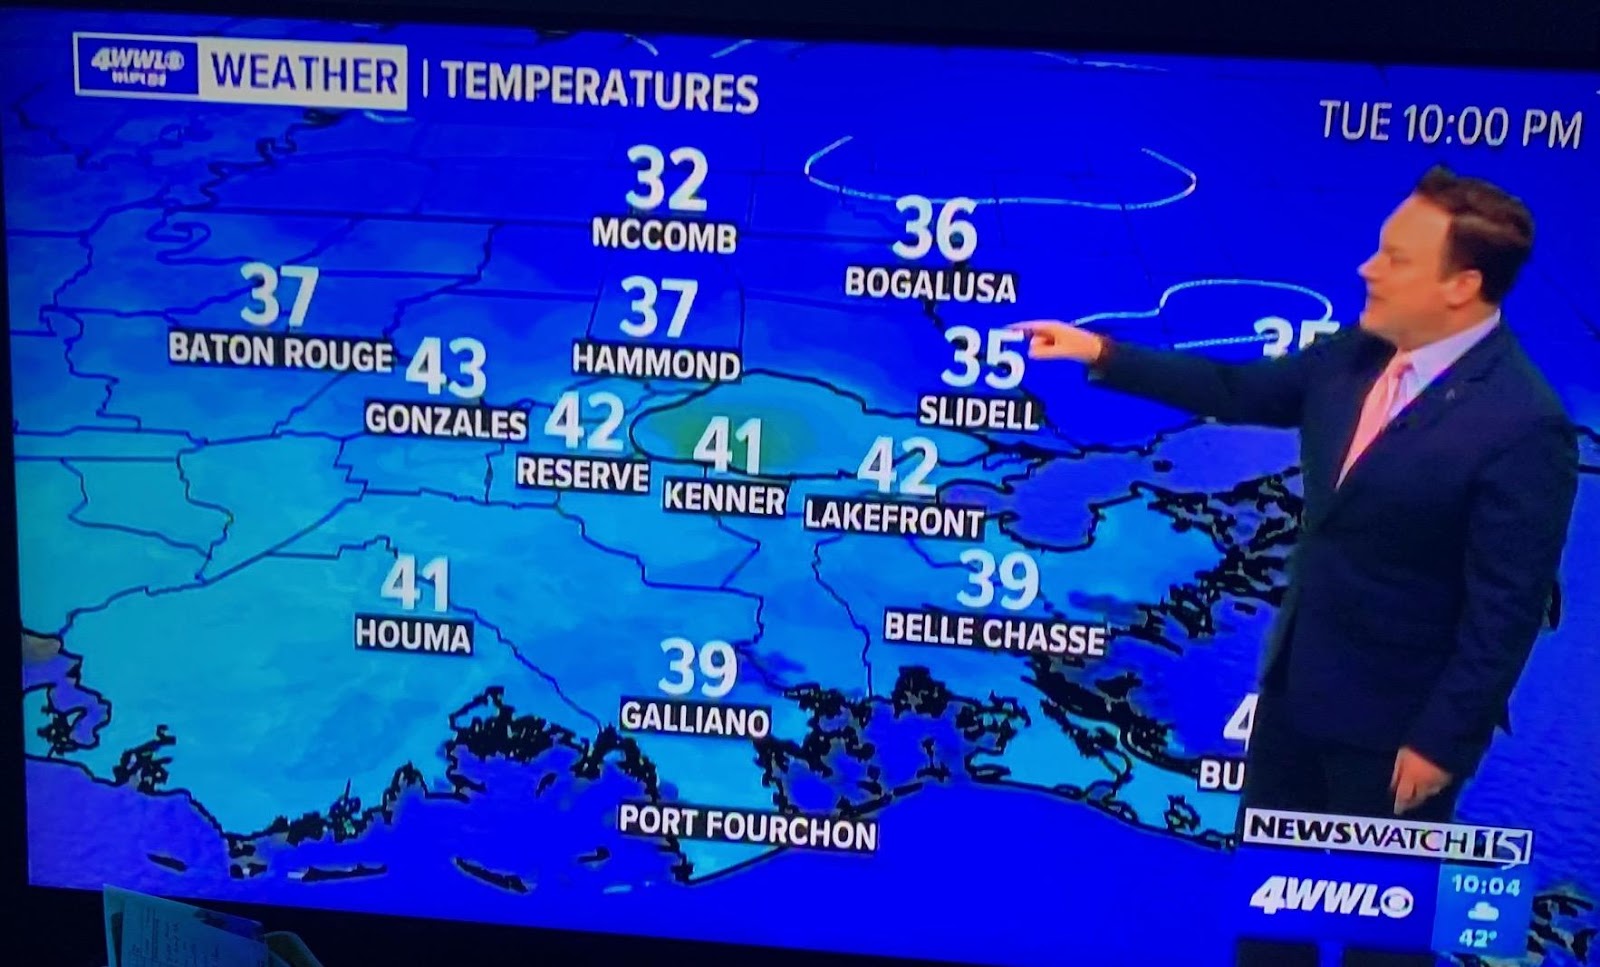
January 12, 2021. Chris Franklyn, WWL TV.
In the spring, the lake works just the opposite. It warms gradually (the cool water bag effect), so it keeps south shore cooler longer than north shore.
The following average minimum temperatures (compiled by Nash C. Roberts, Jr. Consultants, Inc.) for 1989 show this protective action of the lake (during this season, however, the weather was mild so the lake acted as a buffer all year long):
Covington New Orleans
Dec 30.5°F 38.3°F
Jan 47.6°F 53.2°F
Feb 43.9°F 48.4°F
June 68.6°F 72.7°F
July 71.5°F 74.4°F
Aug 70.1°F 74.3°F
3. Position on the continent - At our orientation, the general air flow is from the west. These winds travel over the highly variable interior of the continent, so they carry that weather variability to our region. Colder air arrives in the winter and warmer air in the summer. The western side of the continent receives winds from the sea, so it has a relatively consistent temperature.
HURRICANES (for more and current info, visit the National Hurricane Center – http://www.nhc.noaa.gov, the U.S. Geological Survey – http://coastal.er.usgs.gov/hurricanes/, and the L.S.U. Hurricane Center – http://hurricane.lsu.edu.
Our most powerful weather systems are hurricanes. They go by the following names:
hurricanes: Atlantic, Caribbean, Gulf of Mexico, and eastern Pacific
tropical cyclones: most of S. Pacific & Indian Oceans
typhoons: western N. Pacific
willy-willy and cyclones: Australia
baguios: Philippines (they even make t-shirts as J. C. Conicosa demonstrates)

A hurricane can release enough energy in one day to supply U.S. electrical needs for 6 months.
The following is a selection of terms that one should know in order to understand the nature of hurricanes.
Cyclone - low pressure zone with air rising in a counterclockwise spiral.
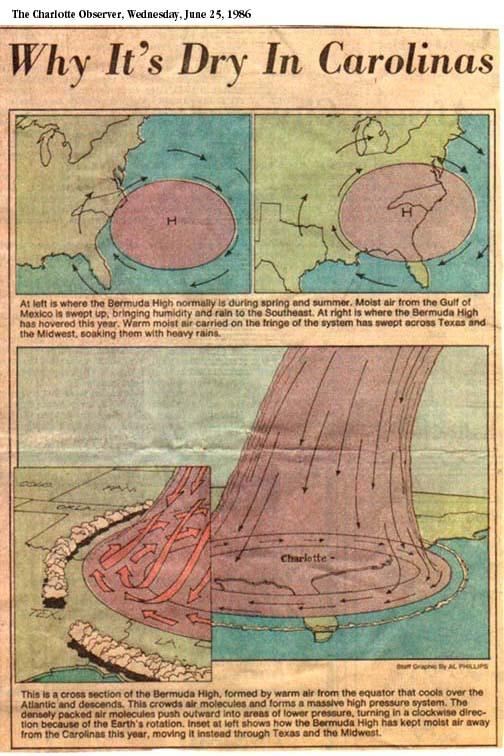
Anticyclone - high pressure zone with air descending in a clockwise spiral.
Convection - the movement of air upward, due to thermal qualities or updrafts.
Bermuda High - an anticyclone that, from early summer until mid-autumn, locates over the mid-Atlantic Ocean and southeastern U.S.
Let’s take a look at how we recognize highs and lows on a daily basis:
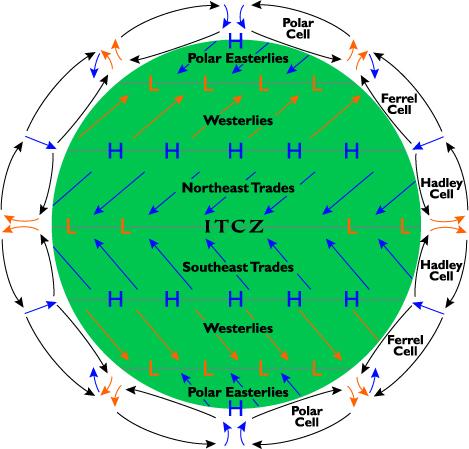
Easterlies (tradewinds) - south of the Bermuda high, these winds normally flow from southeast to the northwest. Easterlies may reach as high as 40,000 ft or more and travel over great expanses of the Atlantic Ocean into the Gulf of Mexico. See the illustration below.
Easterly (=tropical) waves - Low pressure areas that normally originate over equatorial Africa and move westward in the easterly tradewinds. They are oriented north-south, are about 20° latitude long, and are spaced about every 15° longitude. Associated clouds are easily spotted on the 6 o'clock news aerial photos by their northeast to southwest orientation on the west of the wave and southeast to northwest on the east. Sometimes they are the result of a polar trough separating at its tip, but they still move in the easterlies.

http://www.newmediastudio.org/SiteInfo/Portfolio/Hurricanes/tutorial%20…
http://www.cla.sc.edu/geog/faculty/carbone/modules/mods4car/tropcycl/pa…
Westerlies - winds of the temperate zone that blow from northwest to southeast. See the illustration below.
Polar trough - an area of low pressure embedded in the westerlies that may be pushed south.

http://www.hpc.ncep.noaa.gov/international/training/synopt/sld010.htm
Intertropical convergence zone (ITCZ) (=equatorial trough, doldrums) - a low pressure zone located around the equator between the easterly tradewinds of the northern and southern hemisphere. It varies from being almost undetectable to being a zone of intense storms. Its location varies from day to day, but its seasonal variation is from the vicinity of the equator in February to about 12° Ν latitude in August. See the illustration below.
From http://www.newmediastudio.org/SiteInfo/Portfolio/Hurricanes/tutorial%20…
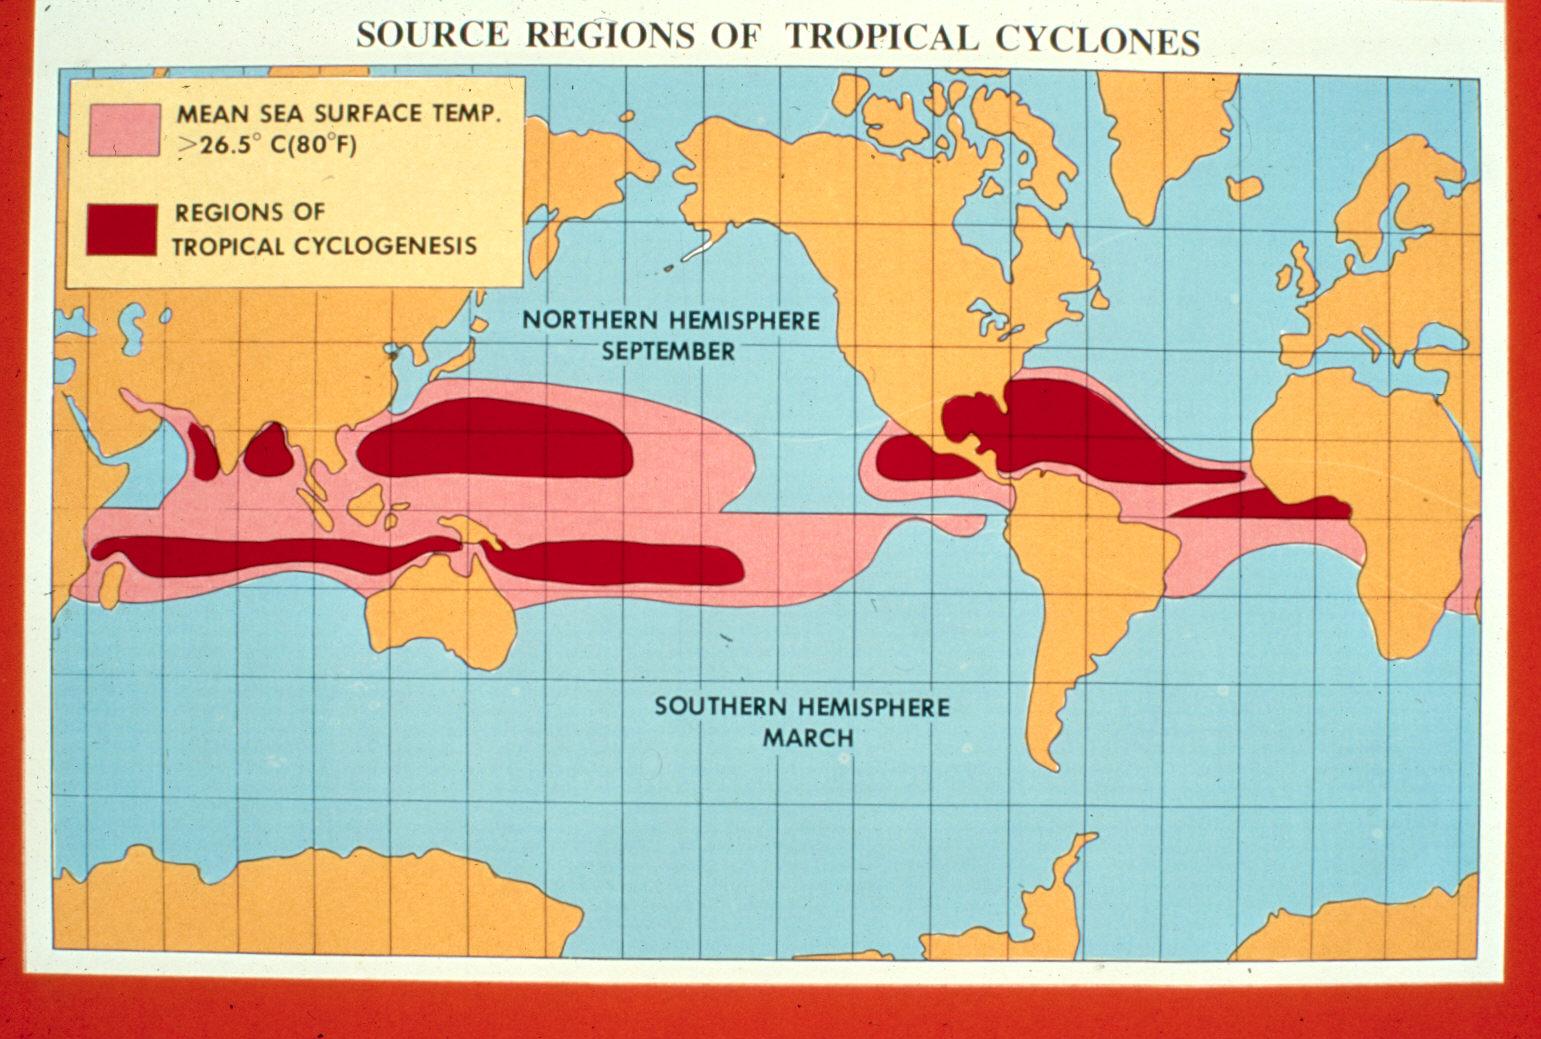
WHERE DO CYCLONES OCCUR IN THE WORLD?
POSSIBLE HURRICANE STARTER MECHANISMS:
The following are three ways cyclonic wind circulation may begin that may lead to a hurricane.
Polar trough - In early summer, the Bermuda high slips south and weakens. This may allow a polar trough to move farther south. If the southern tip of the trough gets trapped in the prevailing easterlies of the tropics, it may break loose and develop into an easterly wave. It is already a low pressure cyclone, so if the right circulation increases, it may become a hurricane.
Easterly wave - Here we are discussing those that originate off the coast of Africa and travel westward. Many of these change little in form and simply dissipate. Occasionally, however, one develops greater cyclonic circulation and may become a hurricane.
ITCZ - an area of circulation may develop at the periphery, break loose and move into the easterly tradewind belt and intensify.
STEPS THAT OCCUR AFTER A VORTEX IS FORMED
1. Initial vortex creates a region into which air from the surroundings flow, accelerating the convection already occurring. If the air has become warm and moist from flowing over tropical waters, it adds energy to the system.
2. As the warm, moist air rises in the cyclone, it cools and water vapor and heat energy are released. The heat energy drives the wind system and the vertical circulation acquires greater organization.
3. If high altitude winds of the proper speed blow over the vortex, they draw the air, now drier and with decreased energy, upward more quickly and distribute it in an anticyclonic fashion away from the vortex. This pumping action 1) continues to decrease the pressure in the cyclone and 2) prevents the cyclone from being filled with cool air and thus deteriorating. It is possible only if a convective chimney has developed.
4. MOVEMENT. The cyclone continues to move northwestward in the easterlies on a curved course. When it arrives at 30-35°N latitude (the horse latitudes), the general area where it encounters the westerlies, the hurricane may stall (and, if the water is warm, pick up energy) or begin to move northeastward. This is called the point of recurvature. Before this point, hurricane linear movement may be at about 30 mph; after, up to 60 mph.
WHAT MIGHT STOP A HURRICANE FROM FORMING?
1. Wind circulation never gets organized.
2. Not enough energy in the system to carry its development.
3. Other meteorological events that bump them off.
4. The convective chimney does not form.
5. Jet stream or other strong wind shears off the top.
6. Two sticks crossed with salt poured in the center.
7. You have adequate canned goods, stored water, gas tanks filled, windows boarded, and a precise plan of action ready to implement.
-Anatomy of a Hurricane

This is a vertical cross section through the eye of a hurricane.

A plan view of a hurricane shows the location of the eye, convective chimney, and the rainband pattern
NEW ORLEANIAN’S LOVE AFFAIR WITH THEIR HOME-GROWN HURRICANE EXPERT, THE LATE NASH ROBERTS, JR.
Every longtime citizen of the Greater New Orleans area will say that he/she was totally confident in Nash Roberts, Jr., meteorologist for WWL-TV and other stations during his distinguished career. His reign as weather guru was before all the sophisticated predictive technology we have today, but those who knew him understood his depth of knowledge and data analysis skills. On camera, he simply strolled out with his magic markers and told his audience where his analysis placed the storm and why. He was always right, and normally made better predictions than anyone else. He became legendary.

Nash did have an advantage. In the above image, Nash makes a prediction as he uses the hurricane icon to show location and people inferred the size from that of the image. As people all along the Gulf Coast watched, they already believe he was the best. The image of the hurricane off the southeast coast of Louisiana looked far, far away. Viewers were comfortable that they were safe. (Times-Picayune, July 25, 2006, C-1).
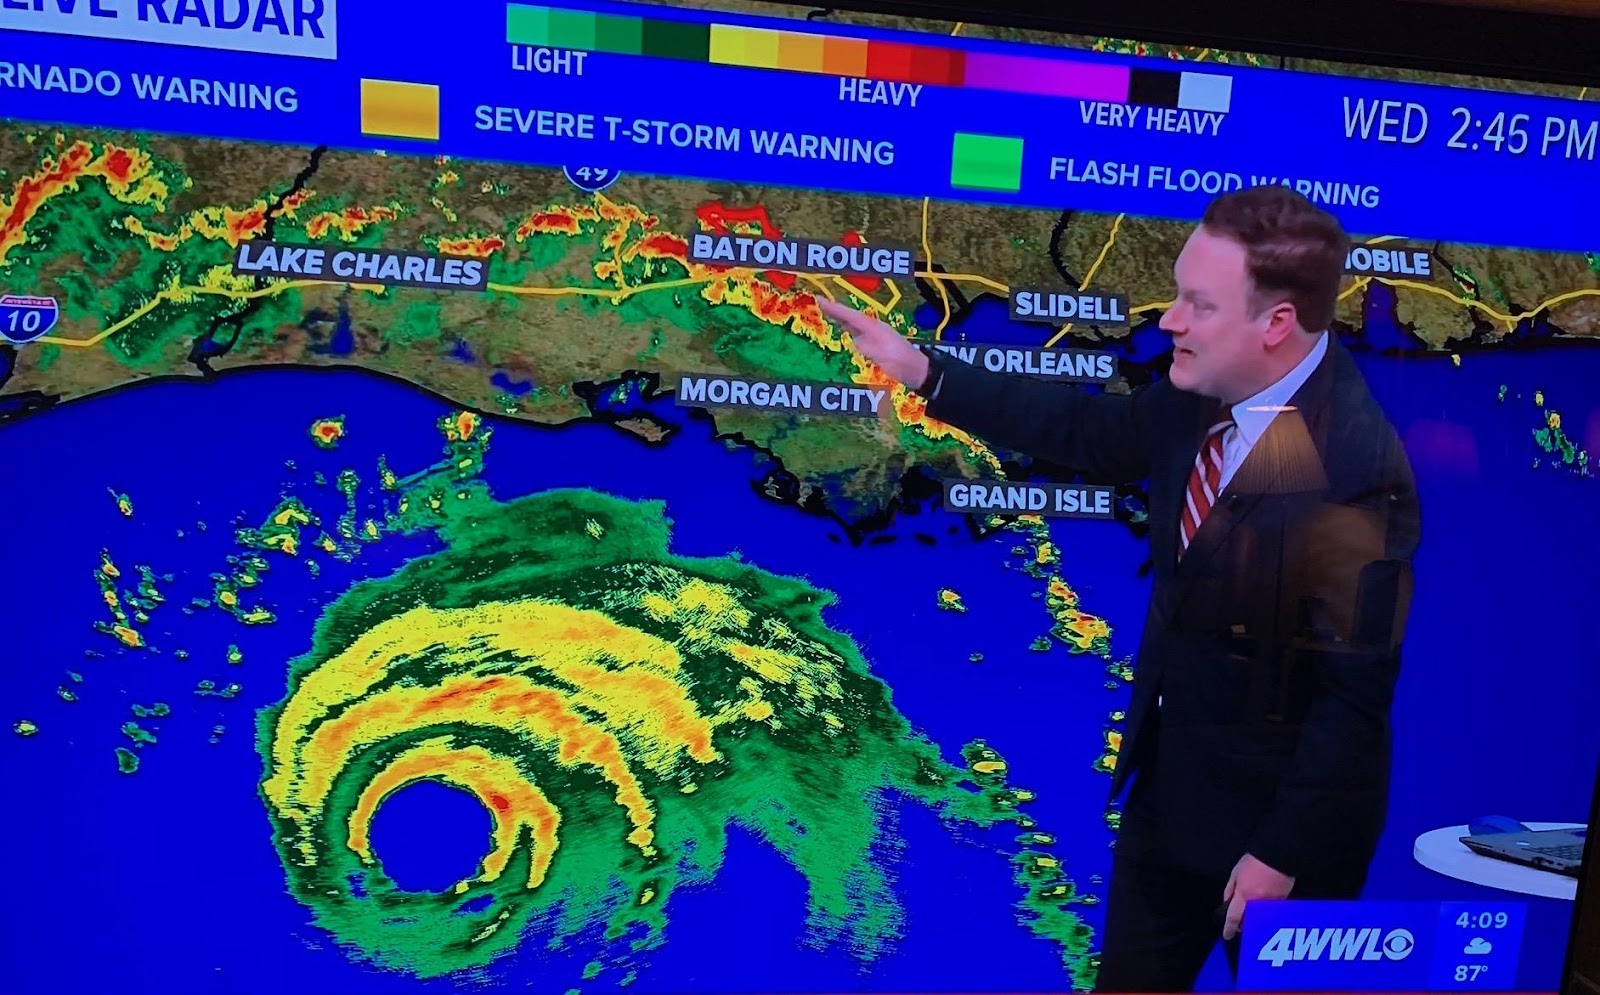
With today’s technology, the image of Hurricane Katrina below is used instead of the hurricane icon and the enormous size of the storm often overwhelms viewers with fear as we see the size and coverage of the approaching storm.

Hurricane Katrina, August 2005.
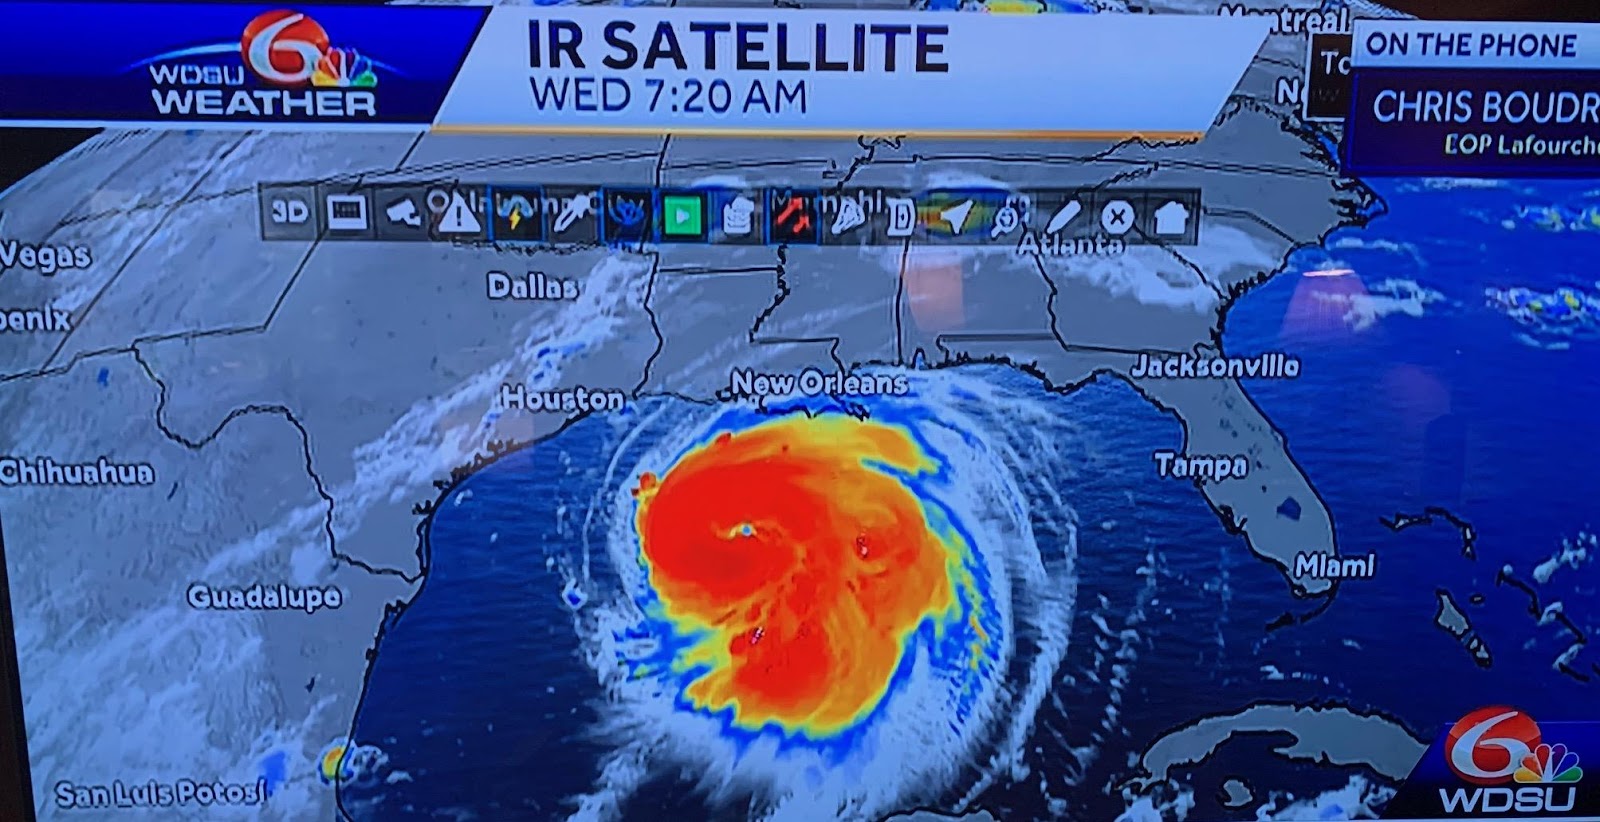
Above 2 images, Cat 4 Hurricane Laura, August
26, 2020. (first WDSU, second WWL TV with Chris Franklyn)
-VIEWS OF HURRICANES

Hurricane Gladys, October 17, 1968.
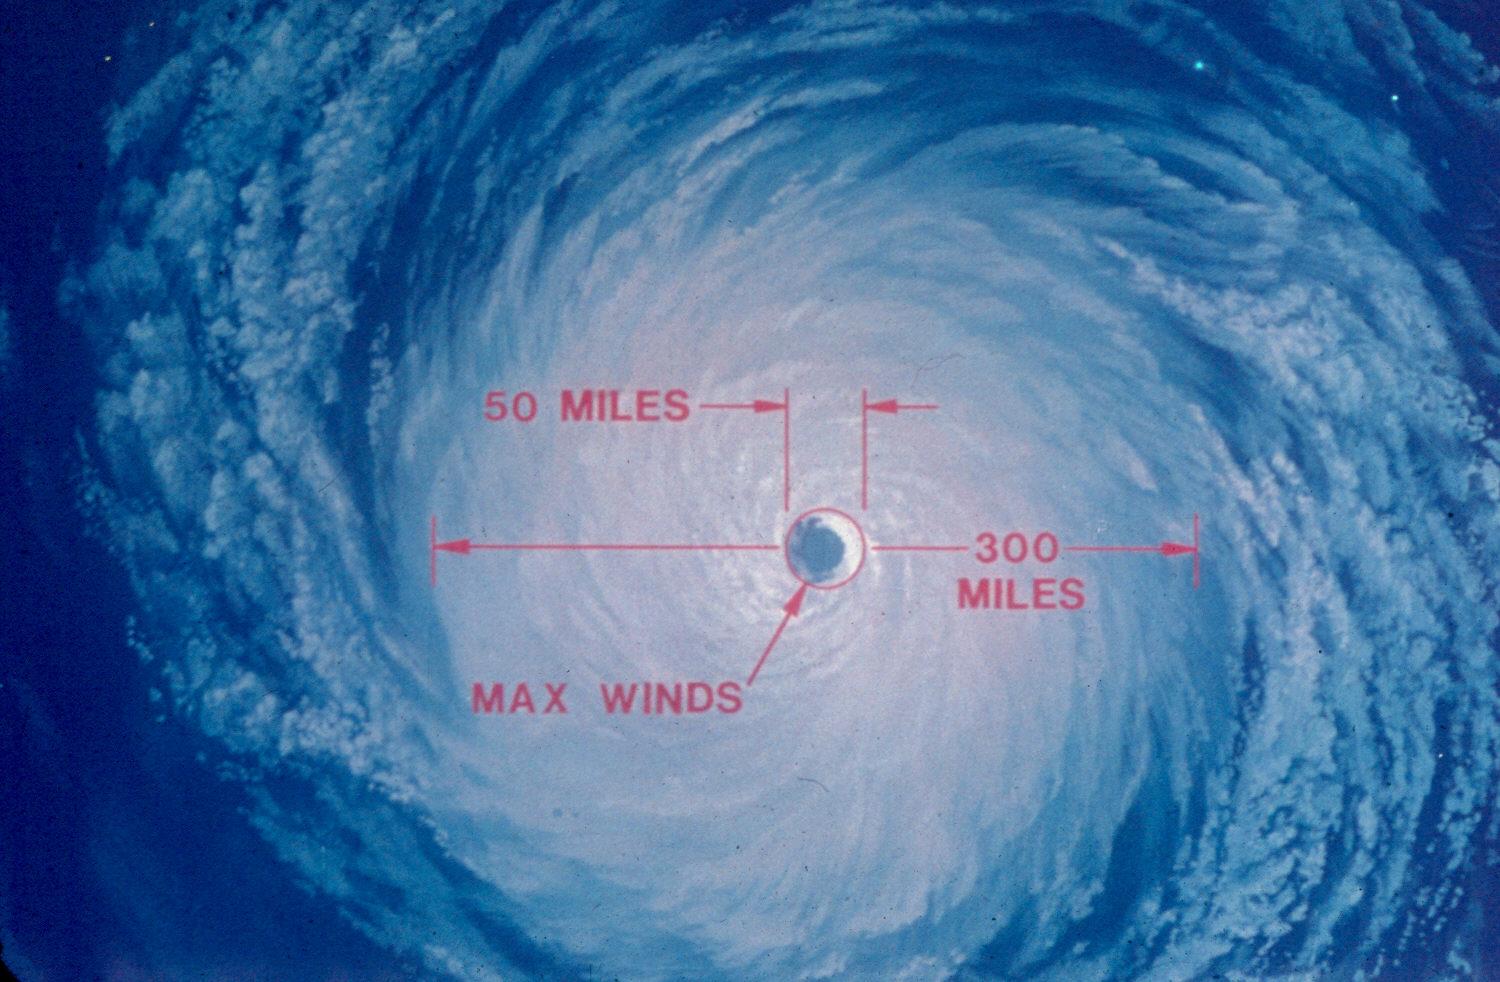
Hurricane Hugo (Category 4) anatomy from above, September 1989.
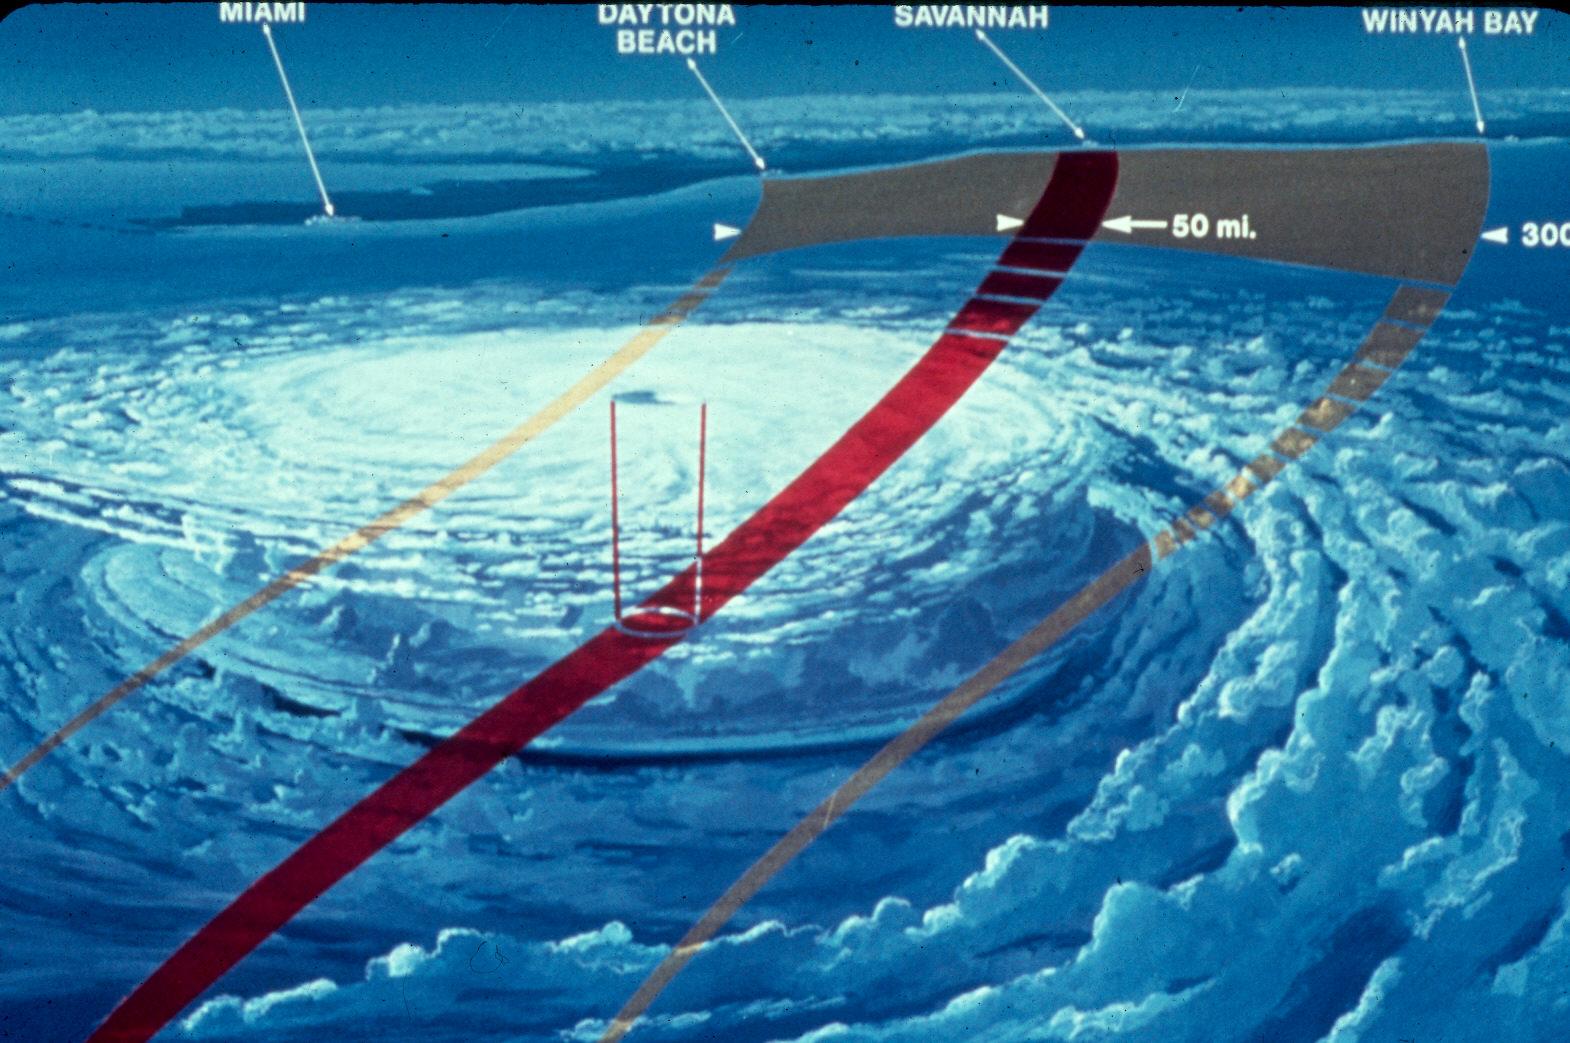
Hurricane Hugo path and width.

In August 1980, Hurricane Isis (Category 2) was in the Pacific while Hurricane Allen (Category 5) ravaged the Texas Coast.
HOW DO WE CLASSIFY CYCLONES?
As low pressure zones (=cyclones) become better organized, 1) their circulation becomes more obvious, 2) there is more organization to their atmospheric pressures (an isobar is a line that separates two areas with consistent pressures; if the isobar forms a circle, then all the area within the circle has the same pressure), and 3) their wind speeds increase. Hence, these are the three criteria used to identify the levels of development ranging from a Tropical Disturbance to a Hurricane.

Isobars for Hurricane Camille, August 17, 1969.
-STAGES OF TROPICAL CYCLONES
|
|
|
|
|
|
|
|
|
|
|
|
|
|
|
|
|
|
|
|
|
|
|
|
|
HURRICANE CATEGORIES: Once a cyclone is classified as a Hurricane, then we have traditionally had a system which categorizes them in levels of strength, and people have come to rely on those levels as an indicator of how they should react as one approaches across the Gulf of Mexico.
THE TRADITIONAL CATEGORIES – changed in the visual presentation used as we will discuss below in 2017:
For a very long time, we have focused our attention on 1) barometric pressure, 2) wind speed, and 3) storm surge. We use the Saffir/Simpson Scale to rate hurricanes from Category 1 to Category 5.
-SAFFIR/SIMPSON HURRICANE SCALE RANGES
|
|
|
|
|
|
|
|
|
|
|
|
|
|
|
|
|
|
|
|
|
|
|
|
|
|
|
|
|
|
|
|
|
|
|
|
Though we tend to think of severity on the basis of the category, the truth is that lesser hurricanes can be more dangerous under certain conditions. For example, a very fast moving Category 5 hurricane moving into a sparsely settled area will be much less devastating than a very slow moving Category 3 that has lots of rain hitting and hovering over a major metropolitan area.
This is what is meant by “winds” in hurricanes – Alexandra Cranford, WWL TV.

-FREQUENCY OF RETURNS FOR HURRICANES WITHIN 80 MILES OF NEW ORLEANS – These worked back in the 1900s and before, but no longer, presumably due to warmer coastal waters.
|
|
|
|
|
|
|
|
|
|
|
|
|
|
|
|
|
|
THE NEW AND BETTER COMMUNCATION OF JUDGING THE POTENTIAL IMPACT OF STORMS - began appearing in the 2015 storm season, then fully implemented for the 2016 storm season.
HOW DO WE RATE AND CATEGORIZE TORNADOES? -Fujita Scale for Damaging Wind (Used for Tornadoes)
The Fujita Scale, a system similar to the Saffir/Simpson Scale, is used for tornadoes. Fujita is based solely on wind speed – which is much higher than for hurricanes and certainly more concentrated. Remember: tornadoes are almost always produced by hurricanes.
|
|
|
|
|
|
|
|
|
|
|
|
|
|
|
|
|
|
|
|
|
|
|
|
|
|
|
|
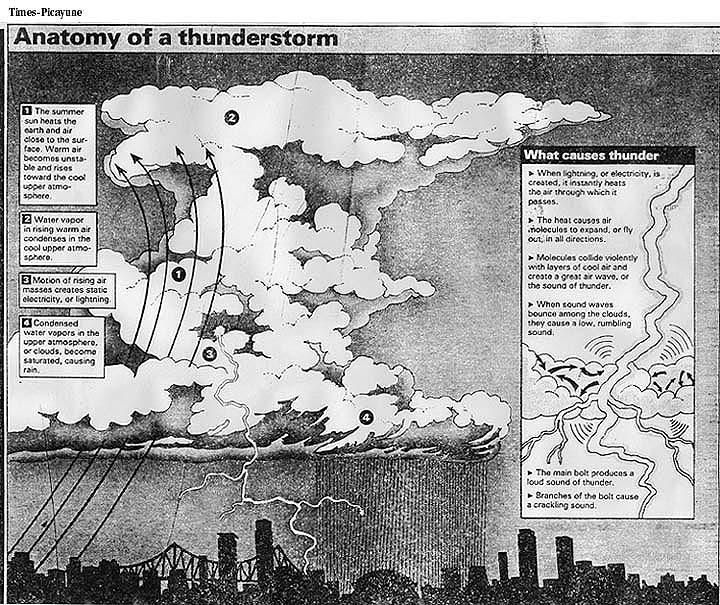
-Anatomy of a Thunderstorm
-Thunderstorms

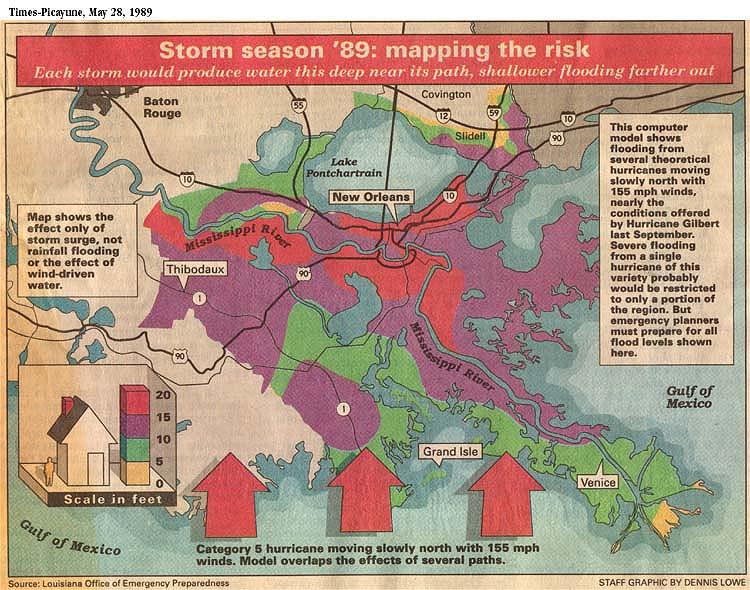
-Storm seasons '89: mapping the risk
-New Orleans Pea Soup (fog and what causes it)

WAYS HURRICANES CAUSE DAMAGE:
1. Winds. Pressure against structures mounts disproportionately with wind velocity.
Example: a 20 knot wind increases atmospheric pressure by 2 lb/sq ft. A 200 knot wind increases atmospheric pressure by 225 lb/sq ft.
We noted that the speed of wind in a hurricane is derived from the storm=s travels over warm water, where it picks up energy. Normally, the power (=energy) of the storm is dissipated once it hits land. Hurricane Danny, which crossed southeast Louisiana on July 18, 1997, was the first hurricane to actually increase in power once it crossed the state’s barrier islands. This was because it was the first storm to travel across this section of our coastal wetlands since most of the marsh became open water, thus presenting the storm not with friction and terra firma to slow it, but with shallow, warm water from which it gained more strength.
2. Storm surge. This is a "bulge" of water being pushed in front of the eye of the hurricane. This is on top of increased tide. For Hurricane Katrina, the surge was 31 ft!
The next time you visit Gulfport, MS, go by the marina just east of the junction of US 49 at the coastal highway. Beside the boat ramps, there is a pole that marks the storm surges from several storms that have affected that area. It is quite impressive. At about eye level is Hurricane Juan (1985), then Hurricane Betsy (1965), then the unnamed hurricane of 1947, then, 25 ft above your head, is Hurricane Camille (1969). This pole gives you an excellent idea of the enormous amount of water that a hurricane can push ahead of its eye.

Gulfport, Mississippi, Marina “hurricane pole,” showing the height of tidal surges of various hurricanes. The mark at the top is Camille, August 17, 1969. Katrina, August 29, 2005, is six feet higher.

Floods in the lower Mississippi River area caused by Hurricane Camille.
Based on information obtained by the U.S. Army Corps of Engineers in the Terrebonne estuary after Hurricane Andrew, a general rule-of-thumb is that for every three miles of healthy coastal marsh that a hurricane crosses, one foot of its storm surge is dissipated. Since Hurricane Camille emerged directly from the Gulf of Mexico to hit the Mississippi Gulf Coast, it had a 25 ft storm surge. Had it crossed a healthy marsh some 75 mi wide, it may have had no surge. This is critical for coastal Louisiana when we consider the speed at which we are losing our storm buffer.
There is terminology used by the National Weather Service and the insurance industry that better predicts potential surge damage (from https://www.intermap.com/risks-of-hazard-blog/2015/06/slosh-meow-mom-understanding-coastal-storm-surge).
Storm surge has devastating impact on coastal communities, with most damage right along the edge of the coast, but often the surge travels are into coastal areas causing much damage.
The storm surge is affected by the following:
- Size of the storm causing the surge
- The tide at the time of the storm surge
- Storm winds (although they are not as damaging as surge)
Categories of storm surge data published by NOAA:
- SLOSH (Sea, Lake, Overland Surge from Hurricanes) models: these are the fundamental models used by the National Weather Service that estimate the height (that is, a measurement of the top of the surge waters above MSL (mean sea level). They are calculated from a specific place and are fan-shaped (see the map below from the website referenced above).
- MEOW (Maximum Envelope of Water): Created by using worst case SLOSH models, so they are calculated for each SLOSH fan. They are used for disaster relief planning.
- MOM (Maximum of the MEOWs): MOM models are produced using the maximum of the MEOWs. They are important for insurers to conservatively estimate where surge water may reach.

Be sure to remember that surges are certainly a human safety issue, but they are also huge economic drivers ranging from insurance, to impacts on businesses and their properties, and much more.
3. Wave activity. There may be 5-10 ft waves on top of the surge. Water weighs 1700 lb/cu yd, so the pounding waves can be deadly.
4. Misplaced currents. These occur because of the dynamic movement of water during the storm; existing currents are simply pushed closer to the shore. These will erode beaches and foundations.
5. Secondary weather. These arise from the hurricane and include rain (flooding) and tornadoes.
HURRICANES ALSO CAUSE EARLY BIRTHS: The rapid drop in barometric pressure associated with hurricanes fills the hospitals with ladies who are close to birth time. After Hurricane Andrew, this sign showed up on Veterans Boulevard in Metairie:

Note the name – Andrew!
On July 11, 1979, the first hurricane named for a man, Bob, formed near the mouth of the Mississippi River and the eye swept over Metairie. Bob Thomas’s wife, Polly, was within a month of delivery, and her water broke (while their daughters played cabbage ball) due to the drop in barometric pressure. On July 13th, Bob’s son Patrick was born, several weeks early due to Hurricane Bob.
How do we determine the impact of a Hurricane? (all 8/30/02)
-Deadliest Hurricanes in the U.S. 1900-1996 - http://www.nhc.noaa.gov/pastdead.html
-Costliest Hurricanes in the U.S. 1900-1996 - http://www.nhc.noaa.gov/pastcost.html
-Most intense Hurricanes in the U.S. 1900-1996 - http://www.nhc.noaa.gov/pastint.html
For the many lessons learned from Hurricane Andrew, one of only five Category 5 storms to hit the U.S. (it was a Category 3 when it hit Louisiana), visit http://www.lacoast.gov/wetlands/willfulwinds/index.htm (8/30/02).
Hurricane tracks.
When a hurricane has completed its destructive course, a plot of its travels becomes its hurricane track. These have been plotted for most hurricanes and look like spilled spaghetti in the Gulf of Mexico
.
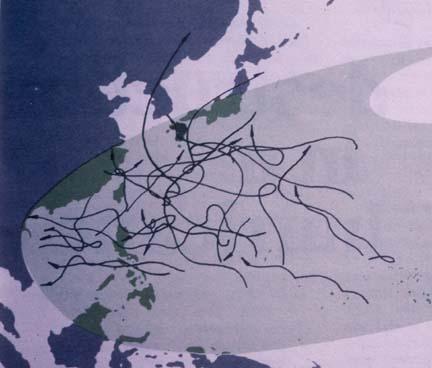
Typhoon tracks in the western Pacific.

Hurricane tracks for the eastern Pacific.
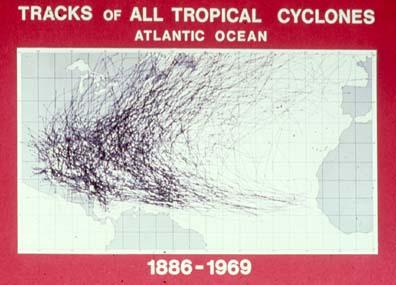
Hurricane tracks in the Atlantic Ocean and Gulf of Mexico between 1886-1969.

Hurricane tracks in Louisiana 1831-1975.
Tropical Storm Eta spaghetti models,
November 9, 2020. WWL TV, Alexandra Cranford.

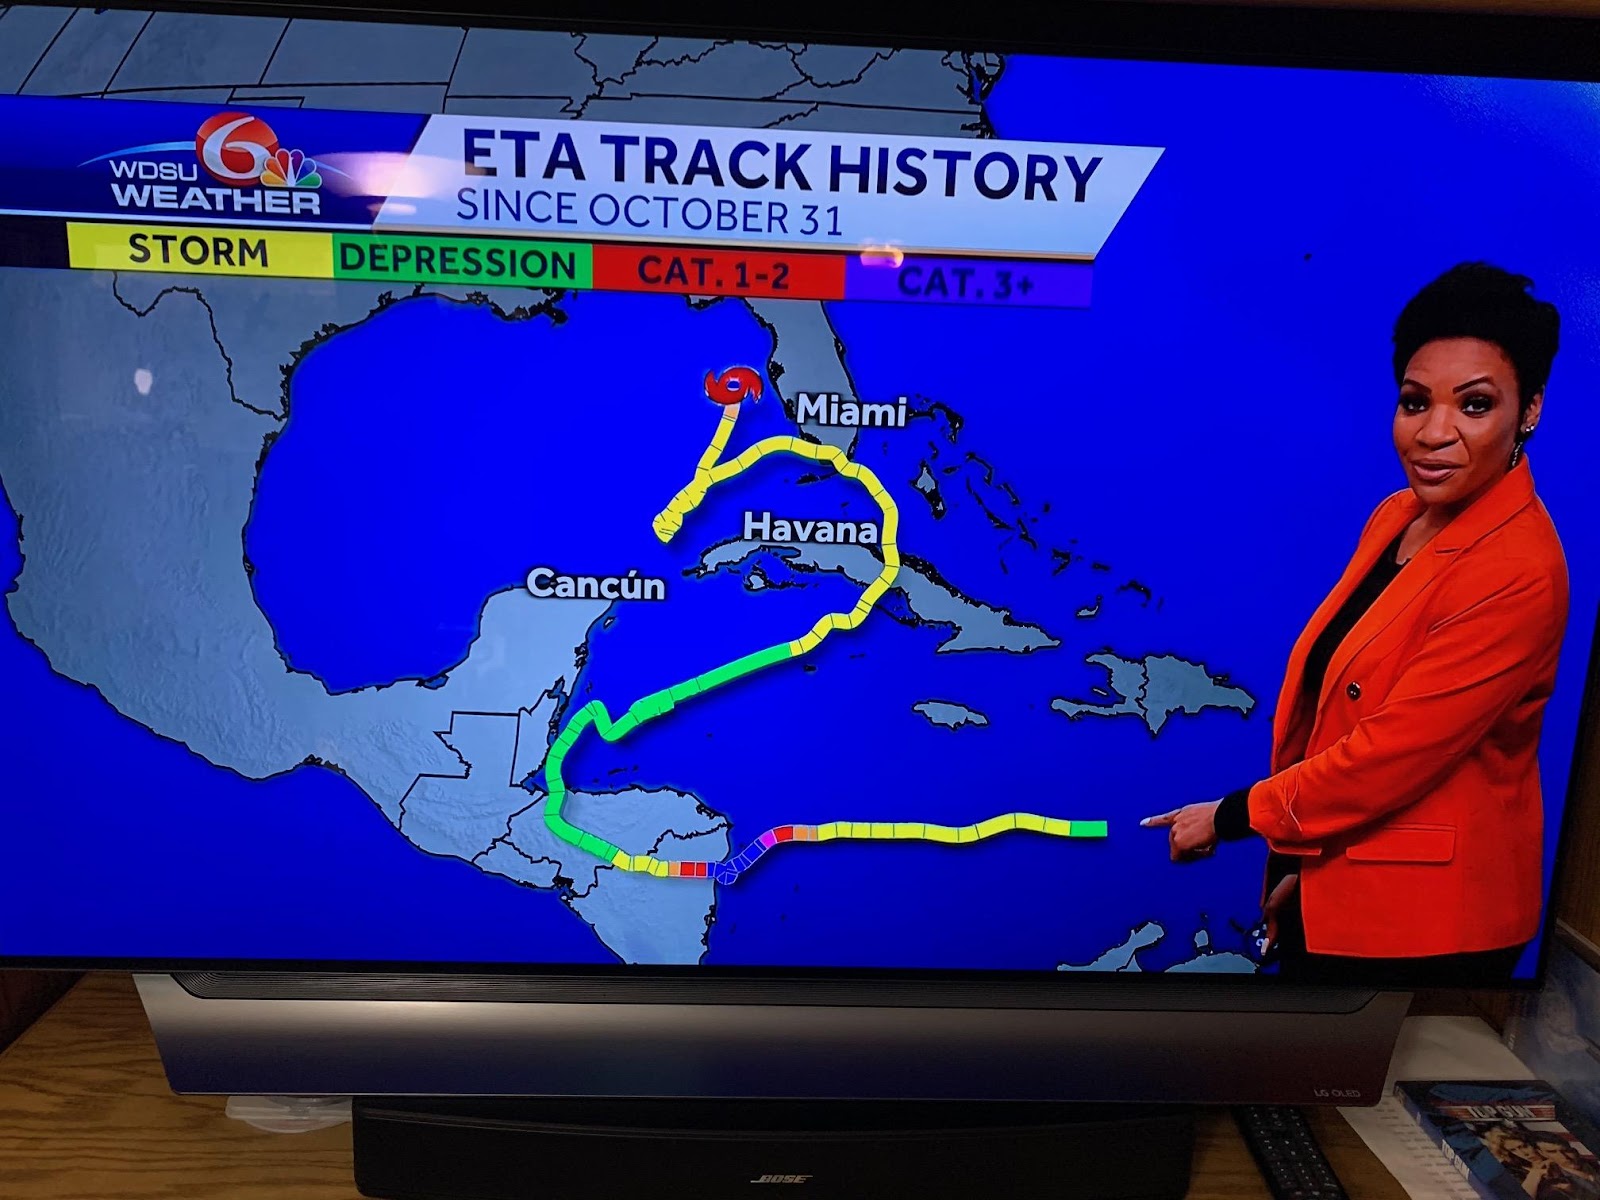
Tropical Storm Eta location off Florida and its actual
track. November 11, 2020. WDSU TV, Kweilyn Murphy.
-Hurricane strikes in the U.S. between 1900-2004 - http://www.nhc.noaa.gov/pastdec.html
-Hurricane Strikes in the U.S. by State, 1900-1996 - http://www.nhc.noaa.gov/paststate.html
Critical Path Hurricanes for the Greater New Orleans Area.
In the 1970s/80s, it was “common knowledge” that the worst-case scenario hurricane (based on a Category 3 storm) for Greater New Orleans would basically follow a path whereby the eye, traveling from the southeast, passes from the Gulf between the Mississippi River and the mouth of Lake Pontchartrain. Since hurricanes have a counterclockwise wind motion, this path would result in the storm pushing water into Lakes Pontchartrain, Borgne, Catherine, and Maurepas.

As the eye nears the center of the lake, the storm would kick to the northeast, thus causing the counterclockwise winds to push the copious amounts of water that had built up on the north shore of the lake south and over the levees into Greater New Orleans. This was common “knowledge” and considered gospel.
To understand these dynamics, imagine what happens when you get into a full bathtub too quickly. As you plop in, the water races to the other end of the tub, then sloshes back and usually over the edge of the tub. This is called a seiche, and such a phenomenon has long been considered the primary culprit for flooding the bowl of Greater New Orleans.
It is projected that such a storm would put about 18-20 ft of water throughout Greater New Orleans.
In fact, Hurricane Katrina (August 29, 2005) caused the same flood, but not the way described for the Critical Path Storm. In the eastern end of the city, the surge that approached the levees was about 10 ft high (30 ft to the east in Gulfport, Mississippi). This, accompanied by the wind, caused levees to break to the south and a 15 ft wave (functioning like a tsunami) that ran west down the Gulf Intracoastal Waterway and overtopped levees into the city on the west side of the Inner Harbor Navigation Canal (Industrial Canal), then broke the levee on its east side and flooded the Lower 9th Ward neighborhood. At the same time, the water in Lake Pontchartrain rose by 12 ft, pushing water down the London Avenue, Orleans, and 17th Street canals and Bayou St. John. The weight of this water resulted in collapses at three places in the first and last named canals, and water running into the city at the southern end of the Orleans Canal where the I-wall between the north side of I-610 and the pump station had never been completed and flow over the eastern low levees of Bayou St. John. No levees were broken along the lake, nor was there damaging overtopping.
What have we done to prevent this catastrophe from happening again?
In the 1970s, the U.S. Army Corps of Engineers proposed to place control structures at the entrance of Lake Pontchartrain that could be closed as a storm approached. Environmentalists feared that the project would interrupt the lake ecosystem in such a way that marine larvae (such as crabs, shrimp, menhaden, etc.) could not move into and out of the lake.

This was the plan for the Chef Menteur Pass. U.S. Army Corps of Engineers.
A lawsuit was filed by Save our Wetlands, Inc., demanding that the Corps perform an Environmental Impact Study before proceeding, as required by the relatively new National Environmental Policy Act of 1970 (NEPA). Instead, the Corps decided it would be most expedient to instead pursue their designed high level plan, composed of 17 ft high levees encircling New Orleans and some adjacent areas.
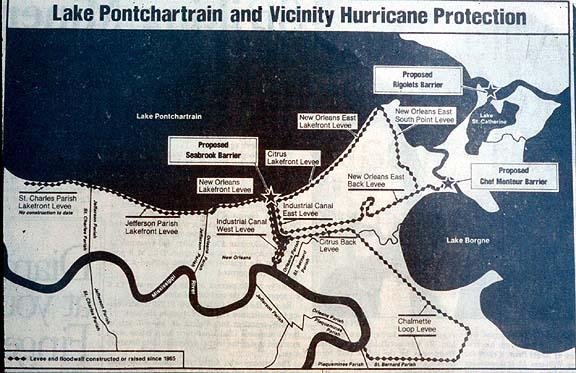
The high level plan. The overall plan for the lake.
The high level plan worked until Hurricane Katrina (2005), a Category 3 landfalling storm that was pushing a Category 5 surge, resulted in the failure of a number of levees in the area.
So, when does one evacuate?
This is the hardest question to answer, and it should definitely be an individual decision. Many say they will never evacuate. Here are my rules-of-thumb.
By June 1st of each year, I am prepared for the hurricane season. I update my belongings inventory (I always pay my flood insurance on time), have at least 10 five gallon bottles of water in my garage, 20 or so butane cylinders for my butane lights and stove, at least two large butane tanks for my barbeque grill, lots of batteries and several good flashlights, plenty of matches, lots of canned foods (many of which I would only eat in a crunch - most of it goes to charity after the season), an axe in my attic (in Hurricane Betsy, a number of people drowned when they crawled in their attics to avoid rising water and became trapped and drowned), a couple of snake bite kits, extra medications that we need, and the like. Once a storm enters the Gulf, my cars have full tanks, I monitor the forecast at least hourly, I constantly tell my family members what I am thinking, I begin to put yard things away, and the like. If it really looks bad, just before I evacuate I fill my bathtubs and all containers in the house with water, get together the things I simply must save and keep them in a place where they can easily be packed in the cars (yes, I have an official list of what I can’t live without so that I don’t have to think about it; I review it at the beginning of the season), call my out-of-town family to tell them what we are thinking and planning, and further batten down the hatches.
If I am absolutely certain that a hurricane will be a Category 1 when it hits land, I don’t leave (but I am ready to if needed). Even at a moderate to low Category 2, I would be hesitant to leave. I would be comfortable if such a storm was approaching from due south, i.e., targeted to cross the coast near Grand Isle.
My family is on stand-by any time a hurricane is heading toward the Gulf of Mexico. If it is a Category 2 when it enters, I assume it will escalate so I begin preparing to leave.
When do I absolutely, definitely, always leave? Anytime we have a Category 3 or above (or a lesser that appears to be escalating to that level) nearing the middle of the Gulf and heading toward New Orleans on a critical path, I’m gone before it hits the center of the Gulf. It is just plain dumb to wait too long and not be able to get out, and it is just plain dumb to stay. Life is not a gamble.
By the way, I also don’t run in front of Big Mack trucks or stick my head in a alligator’s mouth. One of my best friends stayed in his house during a direct hit by Hurricane Andrew. His roof was completely torn off, and he told me that for every minute for many, many hours he expected to die and to see his family die. It was the most terrifying time of his life and he will never make that mistake again.
What is the biggest present fear?
Hurricane Katrina (2005) and its damage educated the masses in the coastal zone to the potential for damage from hurricanes, even when they don’t directly hit where you live. The U.S. Army Corps of Engineers and local agencies have addressed the infrastructural failings that resulted in damages to Greater New Orleans. It is important for citizens to realize that they must use extreme caution. Katrina’s damage did not happen the way we had always thought it would. It did not result in the levees along Lake Pontchartrain being overtopped by the seiche as described above. It resulted from broken levees and a virtual tsunami blasting down the Gulf Intracoastal Waterway and savaging the Lower 9th Ward and its surrounding areas. The rest of the city was inundated due to interior levees collapsing, such as the 17th Street Canal (one failure), the Orleans Canal (incomplete I-wall construction years ago), water flowing into Bayou Saint John, and the London Avenue Canal (two breaks).
The population of the city is once again increasing, with many new citizens. Although most residents know the power of a storm, day-by-day human nature makes us less cautious. If a hurricane approaches New Orleans, many may stay here thinking that the hurricane protection system is better than ever. Evacuation is still tough with this many people. And, very important, the poor have few options of escape!
Will people leave, and will they leave early enough?
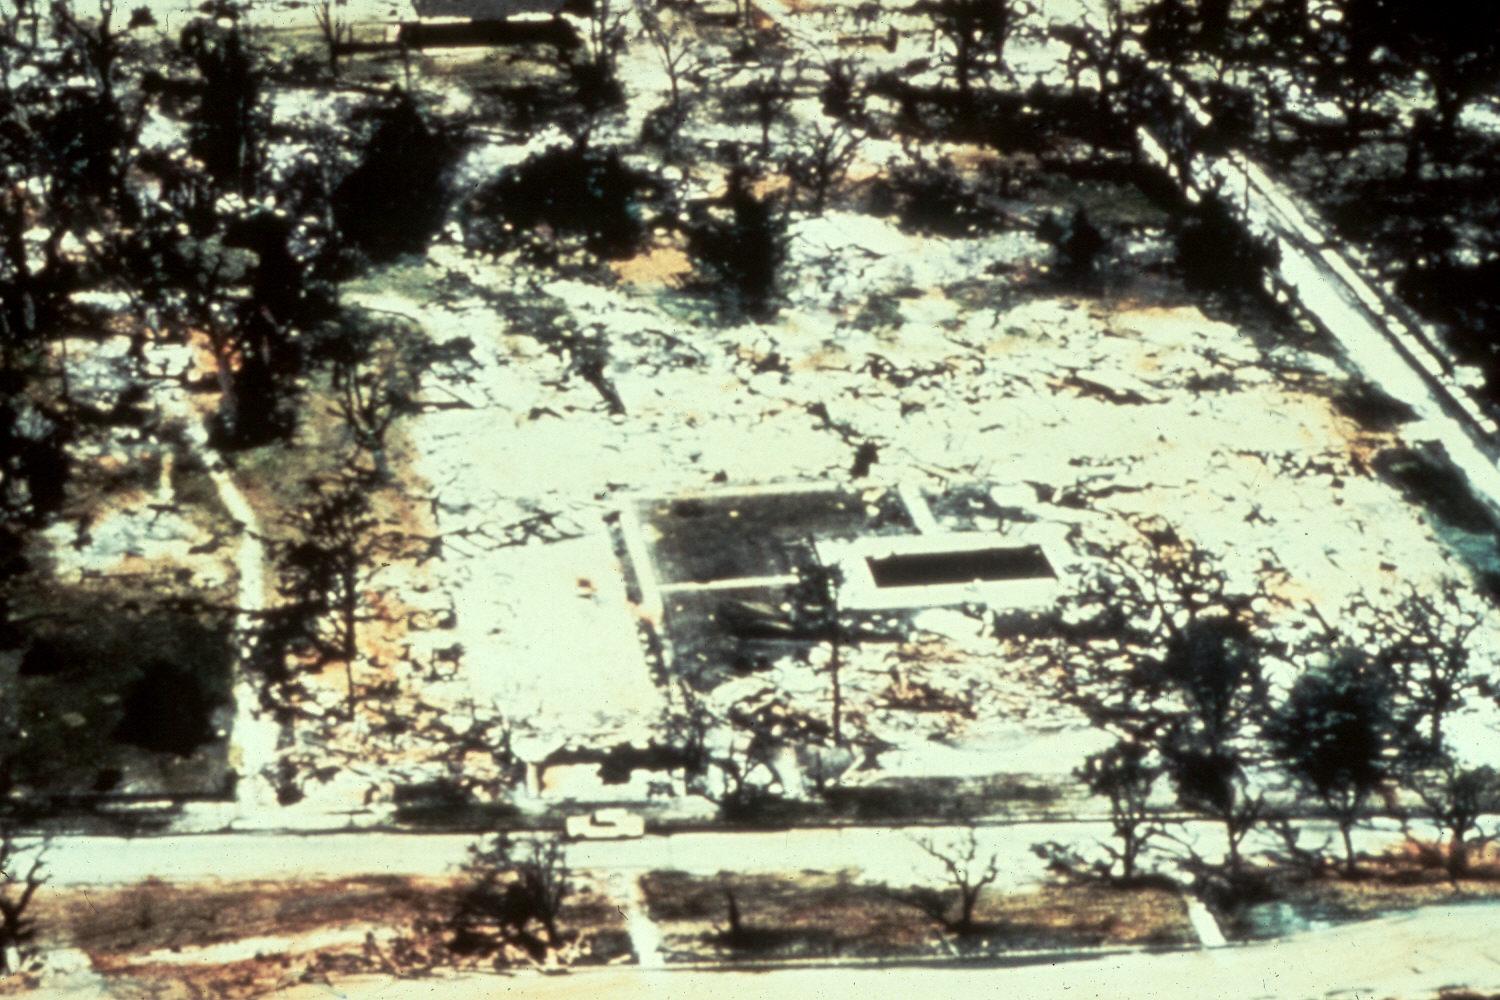
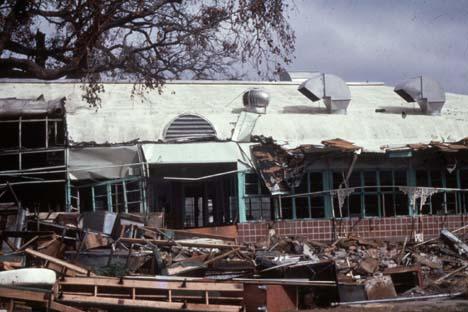
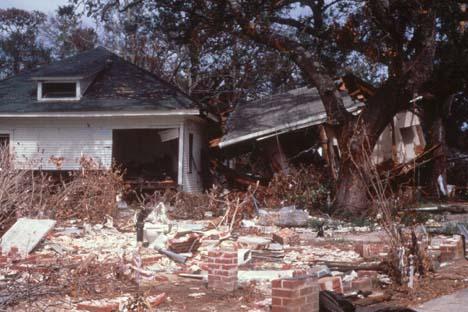
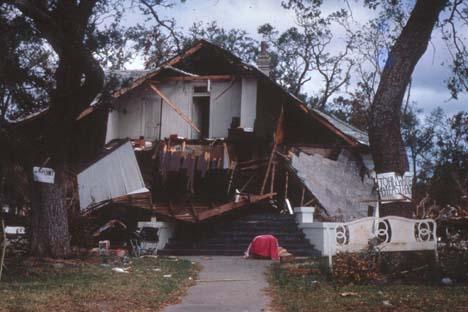
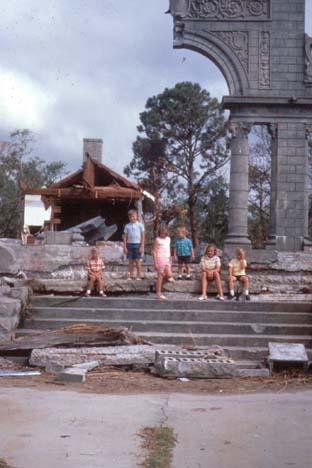
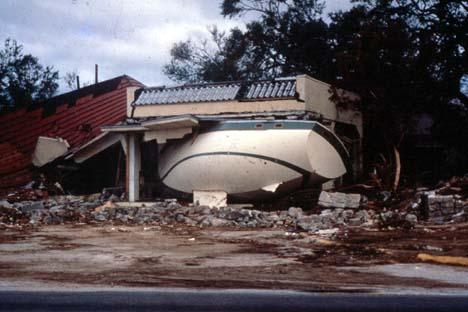
Damage Scenes from Hurricane Camille, August 17, 1969

Hotel Richelieu before Camille.
Hotel Richelieu after Camille.
For several decades, stories were told of young people staying at the Hotel Richelieu remaining in spite of severe warnings to have a “hurricane party.” As the story goes, they all perished. According to journalists who covered the aftermath, this did not happen and simply became believable lore.


Damage Scenes from Hurricane Andrew in Louisiana, August 26, 1992
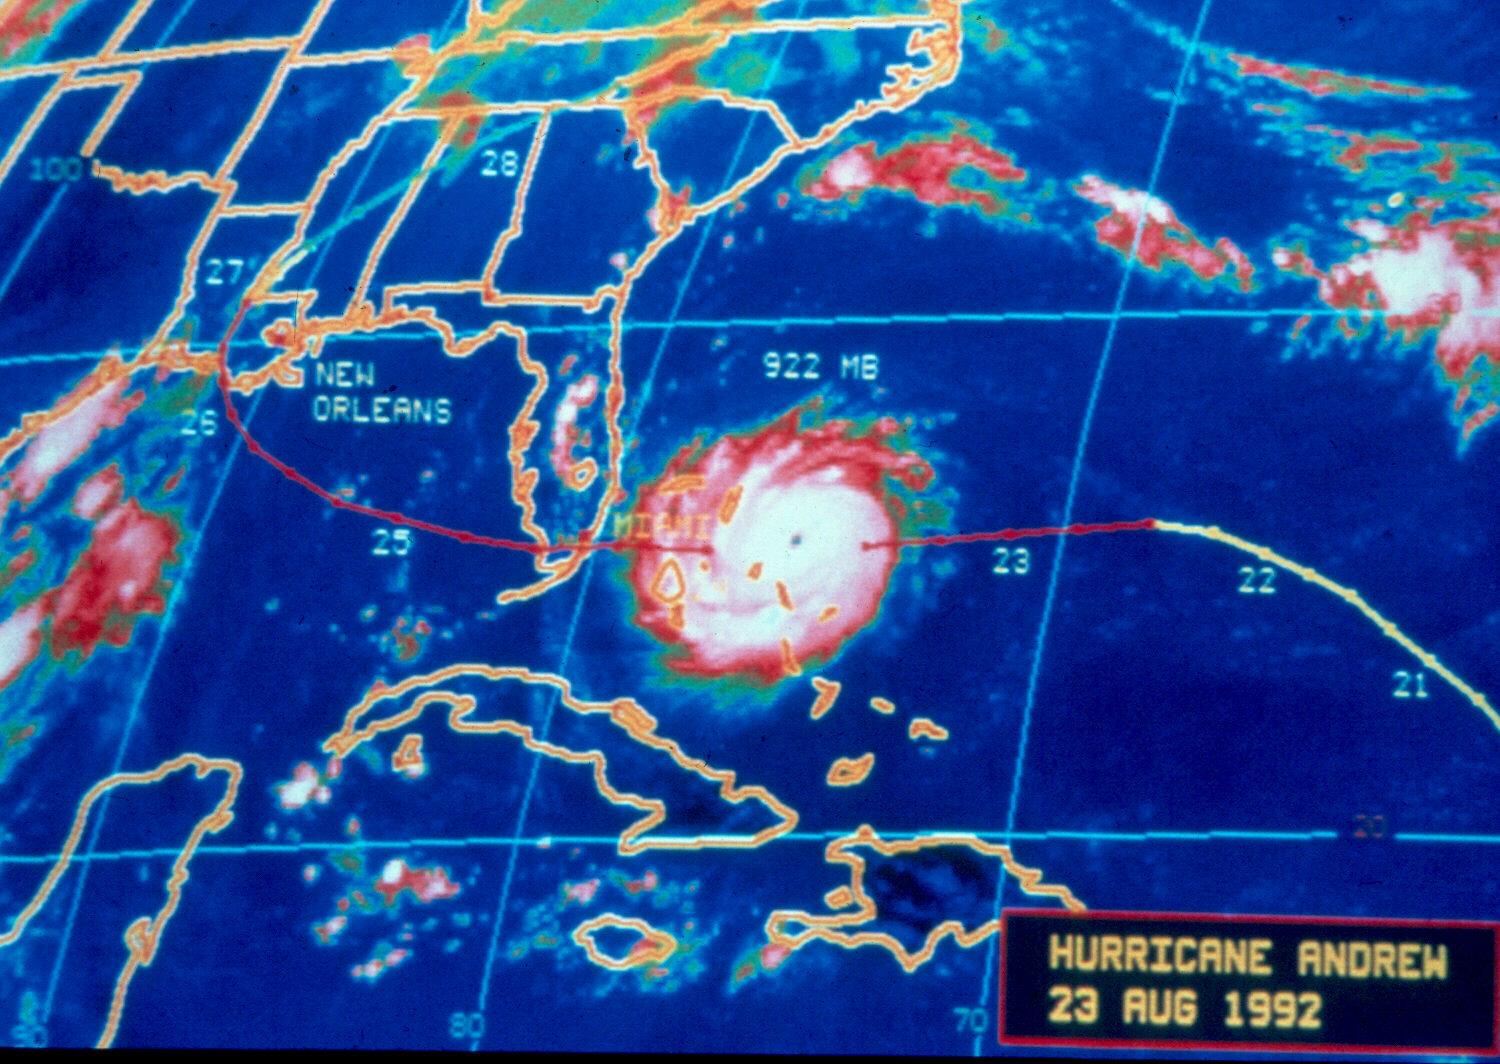
Hurricane Andrew’s track.
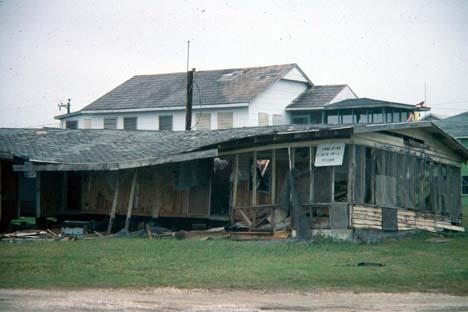
A formerly inhabited camp near Cocodrie, Louisiana.
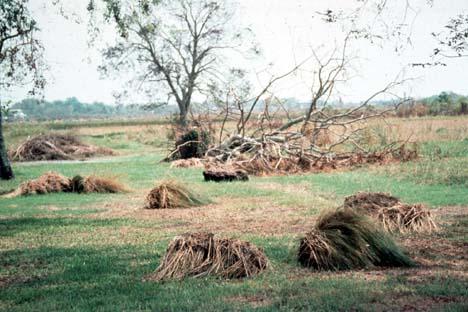
Huge clumps of marsh were hurled about. Photo by Shea Penland.

Damage to Louisiana’s marshes was extensive. Photo by Shea Penland.

The bark was literally blown off cypress tress. Photo by Shea Penland.

Huge amounts of mud were left behind. No big deal in the marsh, but terrible when in your backyard. Photo by Shea Penland.

Flotant marsh was ripped off on the southern edge and pushed up like a blanket at the foot of the bed on a hot night. Note the folds. It was suggested that these flotant marshes would never recover. Photo by Shea Penland.

This photo was taken just south of Houma in a flotant marsh 6 months after Hurricane Andrew. Note the narrow open areas of water. This flotant marsh had been bunched up like the one above, but within this short period of time, it reestablished. The narrow open water areas were the creases in the bunched up marsh, and the intervening green areas were the folds. Wetlands are more resilient than we often admit.
RECENT EXCELLENT SERIES BY THE TIMES PICAYUNE:
http://www.nola.com/hurricane/?/washingaway/